How I'm Building Personalised News Feeds with Semantic Graphs - Part 1

Following the technical explanation of how I'm building the Semantic Knowledge Graphs and Establishing Provenance, let's look at the current (MVP) process of publishing a new set of personalised posts for multiple personas (CEO, CISO, CTO, and Board Members).
The whole process is managed via a FastAPI service running on a serverless function (in this case AWS Lambda)
I'm using the OSBot-Fast-API open source package, which makes it super easy to create these serverless functions (easier than using FastAPI directly)
Here are the default methods that are added when you create and deploy an OSBot-Fast-API project

In the mvp.MyFeeds.ai service, we have a set of APIs for Personas:

... for The Hacker News flows:

... for the Hacker News articles:

... for the Hacker News files:

... and for the Open Security Summit data (although that is not relevant in this article :) )

Looking at the current articles
Looking at the hacker-news-articles/current-articles article data, we can see that every article in there is currently on Step_9 (the current last step)

What we need is a new set of articles to process, so let's see how that is currently done.
Flow 1 - Downloading the RSS feed
We start the full workflow by invoking the endpoint hacker-news-flows/flow-1-download-rss-feed which downloads the RSS feed and converts it into an JSON file

Here is what the feed-data.json file looks like

Flow 2 - Creating the timeline
Next we need to create the MGraph Timeline, which is done by invoking the hacker-news-flows/flow-2-create-articles-timeline endpoint:

The output confirms that all went as planned and that the following 3 files were created:
- hacker_news_timeline - this is the MGraph-DB of the timelines (i.e date/time values) of the 50 articles processed. This file is called feed-timeline.mgraph.json
- hacker_news_timeline_dot_code - this is the DOT Language code (see diagrams as code) created by the MGraph Dot_Exporter. This file is called feed-timeline.mgraph.dot
- hacker_news_timeline_png - this is the Graphviz visualiastion of the DOT code, created by a Serverless function that is fully configured to convert DOT code into PNGs (i.e. images). This file is called feed-timeline.mgraph.png
All 3 files were stored twice in the cloud storage (in this case S3):
- in the /latest/* folder (overwriting the previous version)
- in the 2025/03/26/11/* folder (ensuring we have a copy of this action). This is an hour specific folder, which in this case is /2025/03/26/11/* (representing the 11th hour of the day 26 of March in 2025, i.e. the time I'm writing this article)
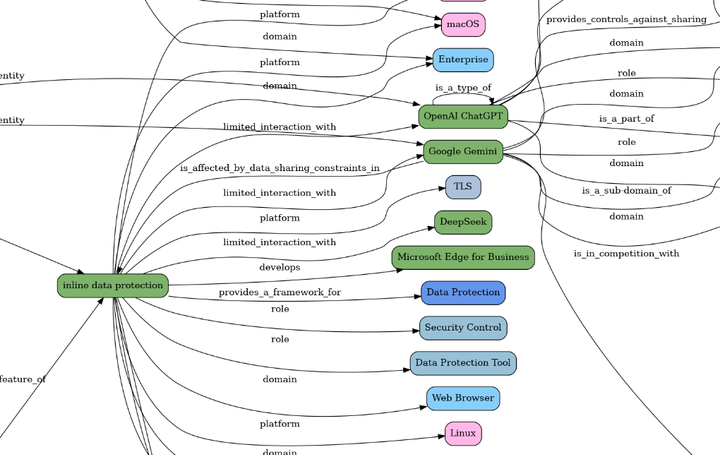
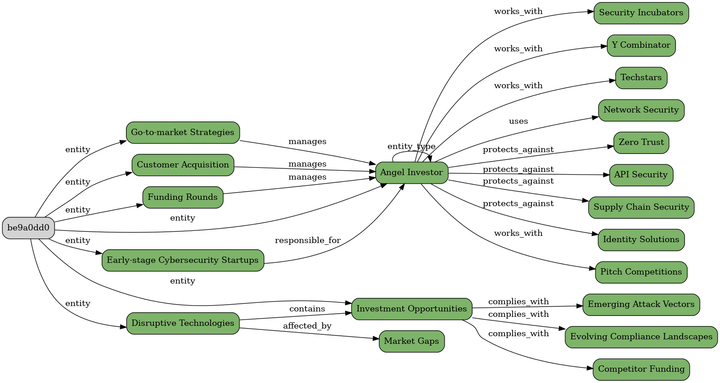
Here is what the MGraph of the timeline looks like:

Here is the DOT language

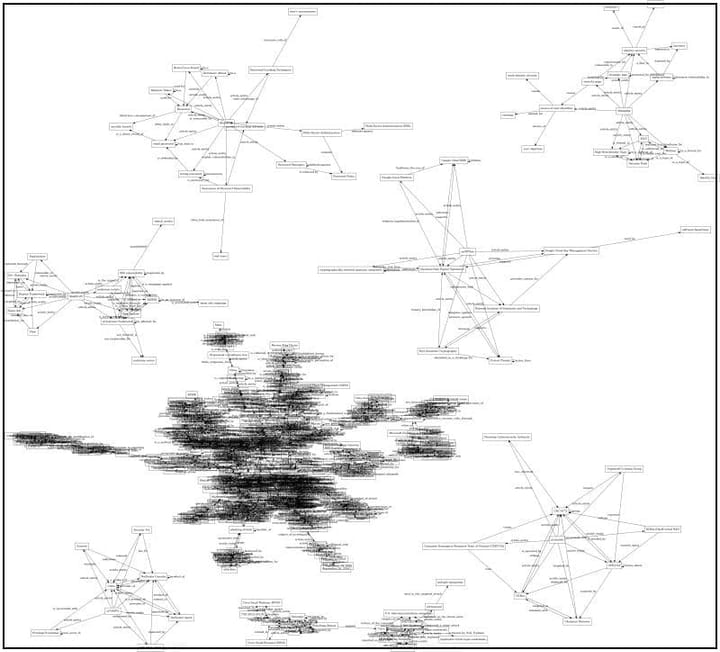
And much more interesting and useful, here is what the PNG of the timeline looks like:

The MGraph above is quite an important one, since it shows the power of the MGraph-DB in creating a graph made of 50x timestamps (i.e. date/time values).
Note how easy it is to find what happened at a particular year, month, day or hour (the nodes at the bottom represent an article)
For more details about this MGraph timeline technology, and how it evolved during multiple coding iterations, see:
- Storing Timestamps in Graph Databases: A Scalable and Semantic Approach (PDF of research paper)
- How Should a Timestamp Be Represented in a Graph?
- More visualisation capabilities to the MGraph-DB "Export to Dot" feature
- First visualization of timestamps from latest 50 articles
- Two visualisations of three Timestamps
- initial visualisation of latest 15 articles
- Visualization of latest 50x articles using multiple GraphViz engines and layouts.
- MGraph-DB timeline is now automatically created and published to S3
Also very important in that invocation response data is the durations section which provides timing details on the duration of each task executed in this flow (this is very important for debugging and keeping an eye on the performance)
The Flows/Tasks technology that is used to create and execute all these "flows", is part of my OSBot-Utils open source package. This was inspired by and compatible with the super powerful Prefect open source and SaaS technology.
For more details about this Flows/Tasks see:
- OSBot-Utils Flow System Documentation (PDF with the technical details)
- Example of using Flows and Tasks in the IDE
- Source code in GitHub
Flow 3 - Extract new Articles
Now that we have an updated timeline, the next step is to call the hacker-news-flows/flow-3-flow-extract-new-articles endpoint with the date to use as current_path (i.e. the new baseline time for creating the MGraph Diff)

Here is the invocation response:

The first file that we can see in the response (created in two locations as before) is the feed-timeline-diff.json, which is a really good example of the power of graphs to answer a simple but important question: "Since the last analysis, which articles were added and removed from the RSS Feed?"
To see how this was done, look at the values of the path_previous and path_current also present in the response data.
In this case we have:
- 2025/03/19/21 - which is the 21st hour of the 19th of March 2025
- 2025/03/26/11 - which is the 11th hour of the 26th of March 2025
This is where the practice to keep two copies of the files created really helps.
The file in the /latest/ folder has long been overwritten by more recent executions, but since we still have the files in the 2025/03/19/21/* folder, we can take a look at the file 2025/03/19/21/feed-timeline.mgraph.png to see what the timeline MGraph looked like at that time:

For reference, here is the current timeline file 2025/03/26/11/feed-timeline.mgraph.png looks like

What we need is a diff of these two graphs.
The MGraph files of these visualisations was used to create the feed-timeline-diff.json file, which looks like this:

... and

This is a MGraph Timeline-Diff object, which contains two main sections: added_values and removed_values, which in practice are the nodes added and removed between those two graphs.
This data is then used to update the latest/articles-current.json files which now contains the entries for the articles ids listed in the added_values in the Step_1__Save__Article step (and empty data in those path_* variables

Continues on part 2